


Methylation‑sensitive restriction enzyme‑droplet digital PCR assay for the one‑step highly sensitive analysis of DNA methylation hotspots
- Authors:
- Published online on: March 14, 2024 https://doi.org/10.3892/ijmm.2024.5366
- Article Number: 42
-
Copyright: © Gattuso et al. This is an open access article distributed under the terms of Creative Commons Attribution License.
Abstract
Introduction
Cancer is the most challenging disease worldwide due to tumor heterogeneity among patients which makes difficult the diagnostic and prognostic procedures, as well as the therapeutic approaches (1). In particular, the lack of therapeutic response or the onset of drug resistance is widely associated with cancer heterogeneity, which often occurs among cancer cells within the same tumor bulk (2,3). Several studies have suggested that epigenetic aberrations along with somatic mutations are involved in the early stage of tumor development and cancer variability (4,5). Among the epigenetic mechanisms, DNA methylation (methDNA) is subjected to profound changes during the tumorigenesis and cancer progression leading researchers to define specific cancer-related epigenetic signatures (6). Specifically, the methDNA consists of the addition of a methyl group at the carbon-5 position of the cytosine within the CpG dinucleotides of the DNA sequence forming a 5-methylcytosine (5mC). Gene expression may be profoundly affected by 5mCs when they localize within key regulatory elements, including transcriptional factors (TFs), enhancers and silencer consensus sites. Additionally, methDNA may drive chromatin remodeling to facilitate or inhibit the access of TFs to gene locus (7,8). Notably, the methDNA patterns are maintained through cancer cell generations representing potential tumor epigenetic hallmarks, which could be used as putative diagnostic or prognostic biomarkers (9). Over the years, several molecular approaches have been developed to evaluate the methDNA status of cancer-related genes, including whole genome methylation analysis through omics technologies (10,11). Currently, bisulfite conversion represents the gold standard pre-processing method for the deep analysis of methDNA status. The procedure is based on the conversion of the unmethylated cytosine in uracil under sodium bisulfite treatment, whereas 5mCs remain unchanged. Subsequently, the amount of the converted cytosines is assessed by methyl-sensitive PCR or DNA sequencing (for example, Next Generation Sequencing) reflecting the CpGs methylation status. However, the degradative processes mediated by bisulfite conversion result in a consistent fragmentation of DNA affecting the downstream analyses, especially for low-quality and/or -quantity DNA samples (12-15). In this context, the Methylation-Sensitive Restriction Enzymes (MSRE) method could be valuable to overcome this limitation since the quality of DNA is unaffected during MSRE steps (16). The MSRE assay is based on the use of MSREs (such as HpaII, AatII and ClaI), which can recognize and digest specific sequences depending on the methylation status of the cytosine of CpG dinucleotides within the restriction sites. In particular, the methylation of these restriction sites inhibits the MSRE endonuclease activity on methDNA targets, whereas the unmethylation results in their complete digestion. The cleavage rate of methDNA target is assessed by PCR whose amplification signal reflects the methylation status of the target at the restriction site (17,18). Furthermore, the MSRE enzymatic efficiency is evaluated by isoschizomers that are not methyl-sensitive allowing the complete cleavage of methDNA targets in the absence of inhibitors. Besides the presence of digestion inhibitors, the diluted samples may be unsuitable for the MSRE pre-processing due to the large quantity of the MSRE digestion mix that should be loaded to reach the sensitive threshold of the following PCR-based analyses (i.e. Real-Time PCR). As a consequence, the amplification efficiency may be affected by the presence of the MSRE buffer as well as the restriction enzymes (19,20).
To overcome some limitations of the standard MSRE and bisulfite conversion for the pre-processing of low-quality and/or -quantity DNA samples, several studies have proposed novel approaches based on the combination of MSRE and the high sensitivity droplet digital PCR (ddPCR) (21-24). Notably, the ddPCR is a high-throughput technology for the absolute quantification of low copies of DNA or RNA targets derived from non-canonical biological specimens, including cell-free DNA (cfDNA) (25-29). In the present study, the MSRE-ddPCR assay was proposed as a one-tube method for the methDNA analysis using a methylation control (spike-in template) for the evaluation of the assay efficiency and data normalization. The advantage of the proposed MSRE-ddPCR method is represented by the capability to perform the MSRE reaction directly in the ddPCR mix before amplification in a one-step protocol. Furthermore, the introduction of a methylation control allows to avoid the use of a restriction enzyme unaffected by methylation (e.g. MspI) used in standard MSRE assays to test the digestion efficiency. This method is suitable for the analysis of poor quality and/or low concentrate DNA (up to 0.625 ng) samples obtained from different biological matrices, including serum and formalin-fixed, paraffin-embedded (FFPE) tissues. As a proof of concept, the MSRE-ddPCR assay needs further validation studies on different biological matrices before introducing this method in a routine setting.
Materials and methods
Cell cultures and melanoma patient specimens
The A375 (cat. no. CRL-1619) and A2058 (CRL-3601) melanoma cell lines were obtained from the American Type Culture Collection, whereas the SK-MEL-23 melanoma cell line was already available at the National Cancer Institute Pascale of Naples. A375, A2058 and SK-MEL-23 cells were cultured in a complete RPMI-1640 medium supplemented with 10% fetal bovine serum (FBS), 2 mmol/l of L-glutamine, 100 UI of penicillin and 100 μg/ml streptomycin (all provided from Gibco; Thermo Fisher Scientific, Inc.). Each cell line was seeded in 100-mm cell-culture dishes (Qiagen GmbH) at the density of 1×10⁶ cells and cultured in a humidified incubator (5% CO2) at 37°C for 48 h. Cell pellets were collected by scraping cell cultures in cold PBS 1X (Gibco; Thermo Fisher Scientific Inc.) and frozen at -80°C until analyses. Consecutive cohorts of 10 FFPE melanoma tissues (Age range: 35-75 years) and 10 FFPE nevi without atypical histological features (Age range: 18-55 years), as well as two serum samples from two melanoma patients that also provided FFPE tissues, were obtained from the National Cancer Institute 'Fondazione G. Pascale', Naples (Italy), using standard procedures. The FFPE tissues and serum samples were collected from January 2019 to May 2020 at the Melanoma Cancer Immunotherapy and Innovative Therapy Unit of the National Cancer Institute 'Fondazione 'G. Pascale' (Naples, Italy). The histopathological features of melanoma samples and sociodemographic characteristics of patients and healthy controls are reported in Table SI. The present study was conducted in accordance with the guidelines of the Declaration of Helsinki (seventh revision, 2013) and approved by the Institutional Review Board of the National Cancer Institute 'Fondazione 'G. Pascale' (Naples, Italy) (approval no. 33/17oss, approved on 10 January 2018). Informed consent was obtained from all subjects involved in the study. All experiments were conducted in duplicate.
DNA extraction
Genomic DNA from A375, A2058 and SK-MEL-23 melanoma cell lines was extracted by using the PureLink Genomic DNA Mini Kit (cat. no. K1820-01; Thermo Fisher Scientific, Inc.) according to the manufacturer's protocol. The cfDNA from serum samples was extracted according to a custom protocol, as previously described (30). Briefly, 1 ml of serum was treated with 240 μl of extraction solution (EDTA (250 mmol/l)/NaCl (750 mmol/l): 100 μl; sodium dodecyl sulfate (100 g/l): 100 μl; proteinase K (stock solution 20 mg/ml): 40 μl) and incubated at 56°C for 2 h. Subsequently, 200 μl of saturated 6M NaCl was added to the mixture to precipitate the proteins. The collected supernatant was mixed 1:1 with phenol-chloroform and incubated at RT for 5 min. The DNA solution was treated with an equal volume of absolute ethanol at −20°C overnight and centrifuged at 14,000 x g for 15 min at 4°C. The DNA pellet was washed with 70% ethanol and finally resuspended in 20 μl of RNAse/DNase-free water. Since the cfDNA amount was undetectable by Nanodrop-1000 (Thermo Fisher Scientific, Inc.), a fixed volume of 5 μl of cfDNA sample was used for downstream analyses. Genomic DNA from FFPE tissues (four sections with a thickness of 8 μm) was extracted using the QIAamp DNA FFPE Tissue kit (cat. no. 56404; Qiagen GmbH) and the deparaffinization solution (cat. no. 19093; Qiagen GmbH) according to the manufacturer's protocols. Nanodrop-1000 was used to assess the amount and quality of extracted DNA by evaluating the 260/280 nm ratio (~1.8 for pure DNA samples).
DNA bisulfite conversion and Sanger sequencing
To perform bisulfite sequencing of SLC22A17 methDNA hotspot (chr14:23,821,229-23,821,230-Assembly: GRCh37/hg19) (Fig. S1A), 1.2 μg of genomic DNA from A2058, A375 and SK-MEL-23 cells were bisulfite-converted by using the EpiTect Plus DNA Bisulfite kit (cat. no. 59124; Qiagen GmbH) according to the manufacturer's protocol. The amplification of bisulfite-converted SLC22A17 target (chr14:23,821,176-23,821,349-Assembly: GRCh37/hg19) (Fig. S1A), whose unconverted sequence contains 15 CpG dinucleotides and 1 CCGG restriction site, was conducted preparing a reaction mix (20 μl) containing 100 ng of the bisulfite-converted DNA, 10 μl of the 2X ddPCR Supermix for Probes (No dUTP) (cat. no. 1863024; Bio-Rad Laboratories, Inc.), 10 μM (final concentration) of forward and reverse primers. The Bisulfite Primer Seeker (https://www.zymore-search.eu/pages/bisulfite-primer-seeker-accessed on 7th March 2022) was used to design the bisulfite primers. PCR thermal conditions and primer sequences are reported in Table I. PCR product was cleanup using the PureLink PCR Purification kit (cat. no. K310001; Thermo Fisher Scientific, Inc.) and sequenced with the Mix2Seq kit (Eurofins Genomics Germany GmbH) according to the manufacturer's protocols. The analysis of DNA sequences was performed by Chromas Lite software version 2.6.6 (https://technelysium.com.au/wp/chromas/) (accessed on 10th June 2022).
DNA methylated and unmethylated controls
A sequence (276 bp) of SLC22A17 gene (chr14:23,821,170-23,821,445-Assembly: GRCh37/hg19), containing 3 CCGG restriction sites, was used to generate DNA unmethylated and methylated controls (Fig. S1B). Specifically, the SLC22A17 sequence was obtained by PCR amplification of A375 gDNA using the Taq DNA Polymerase, recombinant (5 U/μl) (Thermo Fisher Scientific, Inc.) according to the manufacturer's instructions. Primers and PCR thermocycling conditions are included in Table I. The PCR product was purified using the PureLink PCR Purification kit (cat. no. K310001; Thermo Fisher Scientific Inc.) and quantified by NanoDrop-1000 (Thermo Fisher Scientific, Inc.). To obtain methylated control (100% of methylation), the amplified SLC22A17 sequence was treated with CpG methyltransferase (M.SssI) kit (cat. no. EM0821; Thermo Fisher Scientific, Inc.) according to the manufacturer's instructions. Briefly, 200 ng of SLC22A17 PCR product was added to a reaction mixture containing 1 μl of M.SssI enzyme, 2 μl of M.SssI buffer 10X, 0.4 μl of SAM (S-adenosylmethionine) 50X and nuclease-free water to obtain a final volume of 20 μl. The unmethylated control (0% of methylation) was generated from SLC22A17 PCR product using the same methylation mixture without M.SssI enzyme. Both reactions were incubated at 37°C for 30 min and then stopped by heating at 65°C for 20 min. Finally, the methylated and unmethylated controls were purified by using the PureLink PCR Purification kit (cat. no. K310001; Thermo Fisher Scientific, Inc.) and quantified with Nanodrop-1000.
The SLC22A17 methylated (100%) and unmethylated (0%) CTRLs were mixed in different ratios (100, 75, 50, 25 and 0%) maintaining a constant total DNA concentration of 1.25×10⁻⁶ ng/μl.
Custom methylation internal control
To assess the digestion efficiency of HpaII and MspI in ddPCR-MSRE reaction and normalize the percentage of methylation of each methDNA target, methCTRL was generated by PCR amplification of a sequence of the fluorescent protein Clover, which contains 1 CCGG restriction site (Fig. S1C). Briefly, 10 ng of pcDNA3-Clover plasmid gently provided by Dr Michael Lin (Department of Bioengineering, Stanford University, Stanford, USA) (Addgene plasmid #40259; http://n2t.net/addgene:40259; RRID: Addgene_40259) was amplified using the Phusion High-Fidelity DNA Polymerase (2 U/μl) kit (cat. no. F-530XL; Thermo Fisher Scientific, Inc.) according to the manufacturer's protocol. PCR thermal conditions and primer sequences are reported in Table I. The PCR product was subsequently treated with 1 μl DpnI (cat. no. FD1703; Thermo Fisher Scientific, Inc.) at 37°C for 15 min and then the enzyme was inactivated at 80°C for 20 min. Finally, the PCR reaction was purified using the PureLink PCR Purification kit (cat. no. K310001; Thermo Fisher Scientific, Inc.) and quantified with Nanodrop-1000.
Standard MSRE assay
MSRE digestion was performed on gDNA obtained from A375, SK-MEL-23 and A2058 cells. For each sample, three different reaction tubes (final volume 10 μl) were prepared by mixing 200 ng of gDNA, 10−6 ng/μl of methCTRL, 1X CutSmart Buffer (cat. no. B7204), and 20 UI of HpaII (cat. no. R0171S) for tube 1, 20 UI of MspI (cat. no. R0106S) for tube 2, and no enzyme for tube 3 (all the reagents were purchased from New England Biolabs). All the reaction tubes were incubated at 37°C for 1 h and stopped with Proteinase K (cat. no. EO0491; Thermo Fisher Scientific, Inc.) (final concentration 1 mg/ml) incubating the samples at 55°C for 30 min followed by an inactivation step at 95°C for 10 min. Following the standard MSRE digestion, 4 μl of RNase/DNase-free water molecular biology-grade was added to 1 μl of each digested sample for the downstream ddPCR amplification. In addition, to evaluate the effect of potential inhibitors (melanin) on the MSRE digestion, 20 ng instead of 200 ng of SK-MEL-23 gDNA were digested in 10 μl of final reaction volume according to the aforementioned standard MSRE protocol. Of note, 5 μl of these digested samples were directly added to the ddPCR mix for the downstream analysis.
BamHI digestion for ddPCR interference test
To further evaluate the ddPCR efficiency in the amplification of targets digested by restriction enzymes and to evaluate the highest amount of the MSRE digestion mix that can be uploaded in the ddPCR mix, BamHI was used as a restriction enzyme that does not digest the SLC22A17 methDNA target. Briefly, 20 μl of digestion mix containing 20 UI of BamHI (cat. no. R0136S; New England Biolabs, Inc.), 1X CutSmart Buffer (cat. no. B7204; New England Biolabs, Inc.), 80 ng of A375 gDNA, and 4×10⁻⁶ ng of methCTRL was incubated at 37°C for 30 min, stopped with 1 mg/ml of Proteinase K (cat. no. EO0491; Thermo Fisher Scientific Inc.) at 55°C for 30 min followed by an inactivation step (95°C for 10 min). A total of 5 μl of the digested sample (20 ng) was used for the ddPCR amplification. As a control, 20 ng of A375 gDNA and 10−6 ng methCTRL in 5 μl of molecular biology-grade water were amplified in ddPCR.
Standard ddPCR mix preparation
The ddPCR amplification mix was prepared by mixing 11 μl of 2X ddPCR Supermix for Probes (no dUTP) (cat. no. 1863024; Bio-Rad Laboratories, Inc.), 5 μl of each sample, 450 nM of FAM probe (SLC22A17 target), 450 nM of HEX probe (methCTRL), 900 nM of forward and reverse primers for each target and RNase/DNase-free water molecular biology-grade up to a final volume of 22 μl (probe and primer sequences are reported in Table I).
MSRE-ddPCR mix preparation and digestion protocol
Custom MSRE-ddPCR assay consists of one-tube reactions in which methylation-sensitive restriction enzymes (i.e. HpaII and MspI) directly digest the DNA targets in the ddPCR reaction mix. In particular, three different amplification mixes were prepared for each sample, containing HpaII, MspI and no enzyme as undigested control, respectively. The MspI mix was performed as an additional control to assess the enzymatic digestion efficiency. However, this optional control can be avoided because of the use of methCTRL. Briefly, each amplification mix (22 μl) was prepared by using 11 μl of 2X ddPCR Supermix for Probes (no dUTP) (cat. no. 1863024; Bio-Rad Laboratories, Inc.), 900 nM of forward/reverse primers and 450 nM of FAM/HEX probes for SLC22A17 target and methCTRL (probe and primer sequences are reported in Table I). Up to 20 ng of DNA sample and 10−6 ng of methCTRL (final volume 5 μl) were added to each MSRE-ddPCR mix along with 10 UI of restriction enzyme in the HpaII and MspI mix. All amplification mixes were incubated at 37°C for 30 min before droplet generation.
Droplet generation and analysis
Droplet generation was performed by loading 20 μl of ddPCR amplification mix in DG8 Cartridges along with 70 μl of Droplet Generation Oil (cat. no. 1863005; Bio-Rad Laboratories, Inc.) within the sample and oil wells, respectively. Then the cartridge was covered with Gasket (cat. no. 1863009; Bio-Rad Laboratories, Inc.) and transferred into Droplet Generator QX100 (Bio-Rad Laboratories, Inc.) for droplet generation according to the manufacturer's instructions. The droplet mixture was recovered from the cartridge and transferred into a 96-well plate (cat. no. 12001925; Bio-Rad Laboratories, Inc.) to perform PCR amplification by the C1000 Touch Thermal Cycler (Bio-Rad Laboratories, Inc.) according to the manufacturer's protocol. The ddPCR thermal conditions are reported in Table I. Finally, the QX200 Droplet Reader (Bio-Rad Laboratories, Inc.) was used for droplet quantification. Absolute quantification (copies/μl) of DNA targets was retrieved using QuantaSoft software (version 1.7.4 (QuantaSoft). Amplitude thresholds were set manually by the operator on the basis of positive and negative droplet amplitudes. The fluorescence amplitude of droplets was also considered to evaluate the efficiency of the amplification reaction.
Quantitative analysis of the methDNA percentage
The methDNA percentage of the target genes was retrieved considering the ratio between the ddPCR absolute quantification of the methDNA target in HpaII and the undigested control mix for each sample (first term of Formula 1 and 2). Notably, this ratio is 1 when the methDNA target is fully methylated (100% of methylation), while it is 0 when the methDNA target is completely unmethylated (0% of methylation).
 |
 |
To overcome the bias in methDNA percentage estimation due to the inhibition of the enzymatic digestion, data normalization was performed by using an enzymatic digestion coefficient computed by the reciprocal ratio between the ddPCR absolute quantification of the methDNA target in MspI and undigested control mix (second term of Formula 1). Similarly, the enzymatic digestion coefficient was obtained by the reciprocal ratio between the methCTRL absolute quantification in HpaII and the undigested control mix avoiding the MspI mix (second term of Formula 2). Notably, the enzymatic digestion coefficient does not affect the methDNA percentage estimation when the enzymatic digestion is completed (enzymatic digestion coefficient=1). Conversely, the methDNA percentage is adjusted when the enzymatic digestion is partially inhibited.
Statistical analysis
Linear regression analysis was computed to evaluate the goodness of fit (R2) obtained from the MSRE-ddPCR analysis on scalar dilution samples of SLC22A17 methylated control. To test the sensitivity of MSRE-ddPCR, the horizontal best-fit lines through the mean of all the methDNA values, obtained from the serial dilutions of SK-MEL-23 and A375 gDNAs, were calculated using Non-linear fit analysis. Differential analysis of SLC22A17 methDNA in melanoma and nevi samples was evaluated by Mann-Whitney test. The difference between the comparing groups was reported as differences between the median levels of SLC22A17 methDNA. Receiver Operating Characteristic (ROC) curve analysis was performed to evaluate the performance and accuracy of the diagnostic test. P≤0.05 was considered to indicate a statistically significant difference. All analyses were executed using GraphPad Prism software (version 8.0.2) (Dotmatics).
Results
MSRE-ddPCR efficiency test
To evaluate the potential interference between restriction enzymes and ddPCR chemistry in enzymatic digestion and amplification processes, MSRE-ddPCR protocol was performed analyzing DNA methylated (100%) and unmethylated (0%) controls obtained from the SLC22A17 sequence (chr14:23,821,170-23,821,445-Assembly: GRCh37/hg19). Specifically, 5×10⁻⁶ ng of each DNA methylated and unmethylated controls along with 10−6 ng of Methylation Internal Control (methCTRL) were added to HpaII, MspI and undigested mixes. methCTRL and SLC22A17 forward/reverse primers and probes were used for the amplification step.
As expected, the results revealed that the number of copies for the SLC22A17 methylated control within the HpaII mix was similar to the undigested sample (45.4±2.38 copies/μl and 42.5±1.7 copies/μl, respectively). Interestingly, the amplitude of SLC22A17 methylated control (FAM fluorescence) in the HpaII mix was similar to the undigested mix, demonstrating that the HpaII enzyme did not affect the ddPCR amplification efficiency (Fig. 1A). Moreover, no amplification was detected for SLC22A17 methylated control within the MspI mix. Similarly, the SLC22A17 unmethylated control showed no amplification within HpaII and MspI reactions compared with the undigested sample, suggesting that the enzymatic digestion efficiency was not affected by ddPCR chemistry (Fig. 1A).
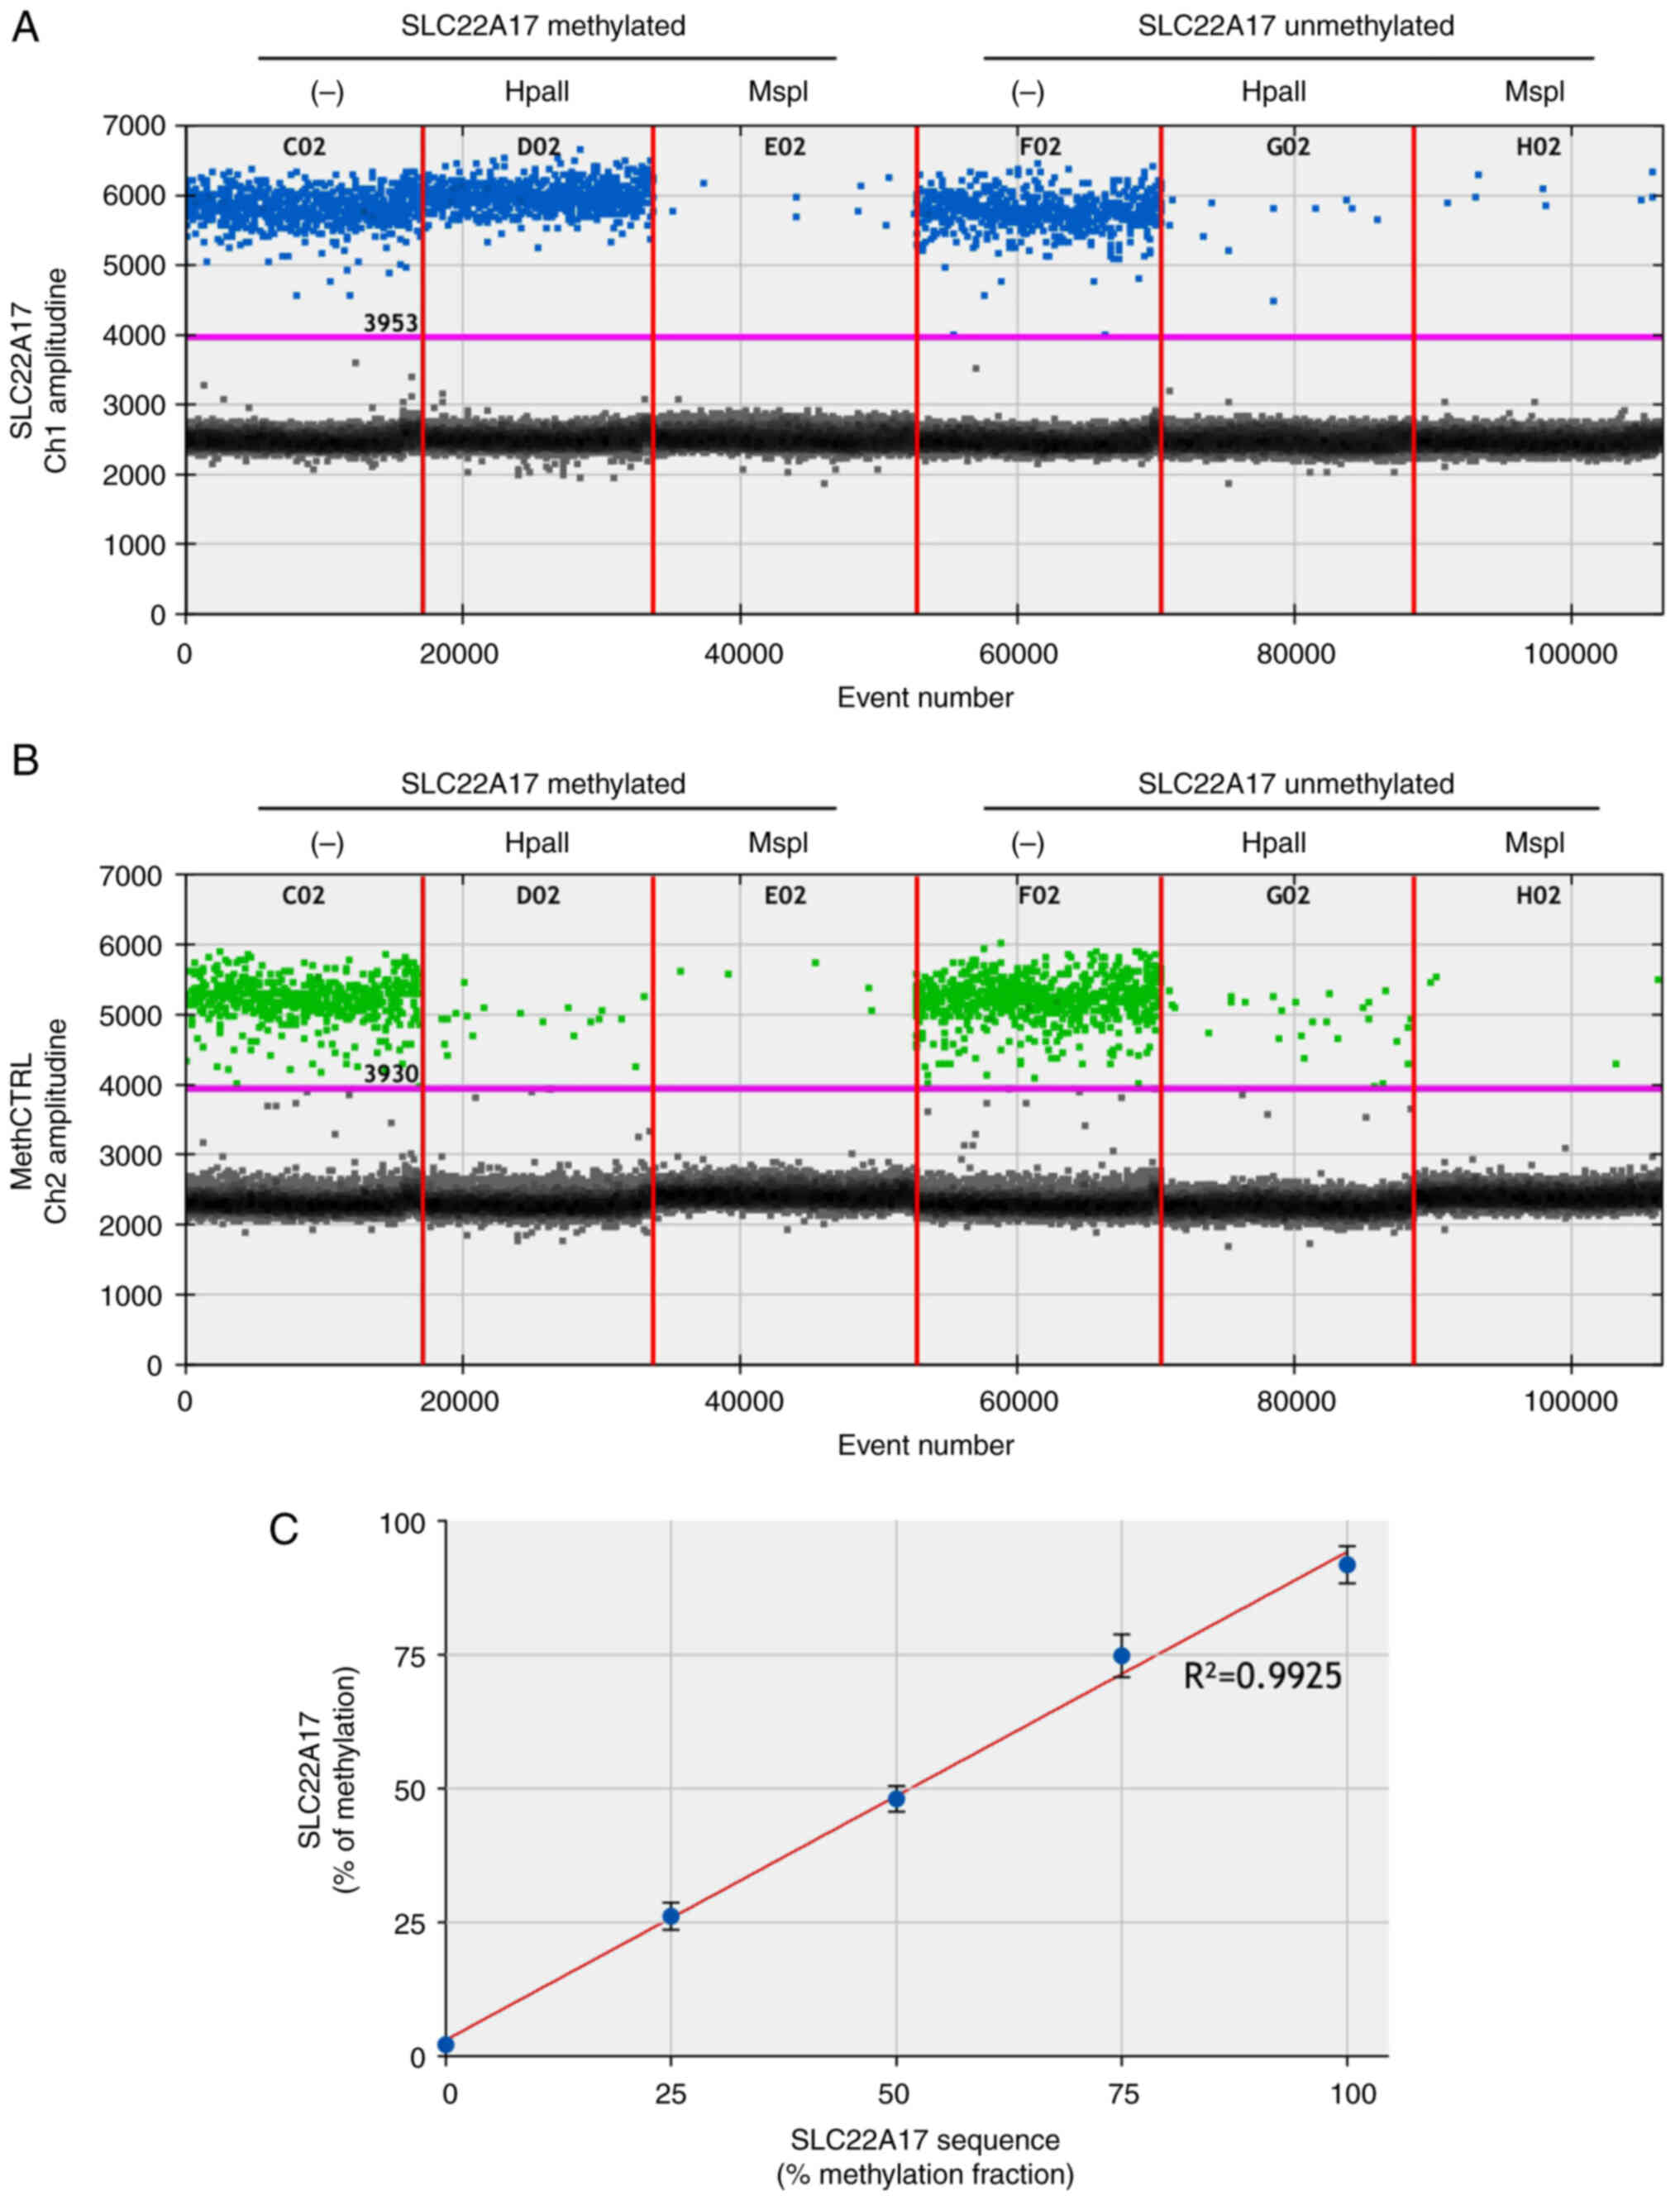
Regarding methCTRL (HEX fluorescence), a similar amplification signal was observed in the undigested mix of SLC22A17 methylated and unmethylated samples (35.4±0.45 and 34.00±0.84 copies/μl, respectively), while a weak amplification signal was detected in both HpaII and MspI reactions (from 0.26 to 1.70 copies/μl) (Fig. 1B). The positive droplets of methCTRL in HpaII and MspI reactions are due to a not complete digestion that never reaches the theoretical 100% efficiency of HpaII and MspI in ddPCR mix. This background signal, detected in each MSRE-ddPCR mix, is removed by normalization procedures during the estimation of methDNA percentage.
To evaluate the accuracy of the MSRE-ddPCR method, linear regression analysis was performed comparing the expected and measured methDNA levels of each SLC22A17 methylated/unmethylated sample (100, 75, 50, 25 and 0%). The results demonstrated a high linear correlation of all expected/measured couples (R2=0.9925) indicating the reliability of the method at different percentages of methDNA target (Fig. 1C).
MSRE-ddPCR analysis on cellular genomic DNA
The MSRE-ddPCR assay was tested on gDNA extracted from different melanoma cell lines evaluating the levels of SLC22A17 methDNA hotspot (Fig. S1) selected in the present study. In particular, the SLC22A17 target was assessed on SK-MEL-23, A375 and A2058 cells (Fig. 2A and B).
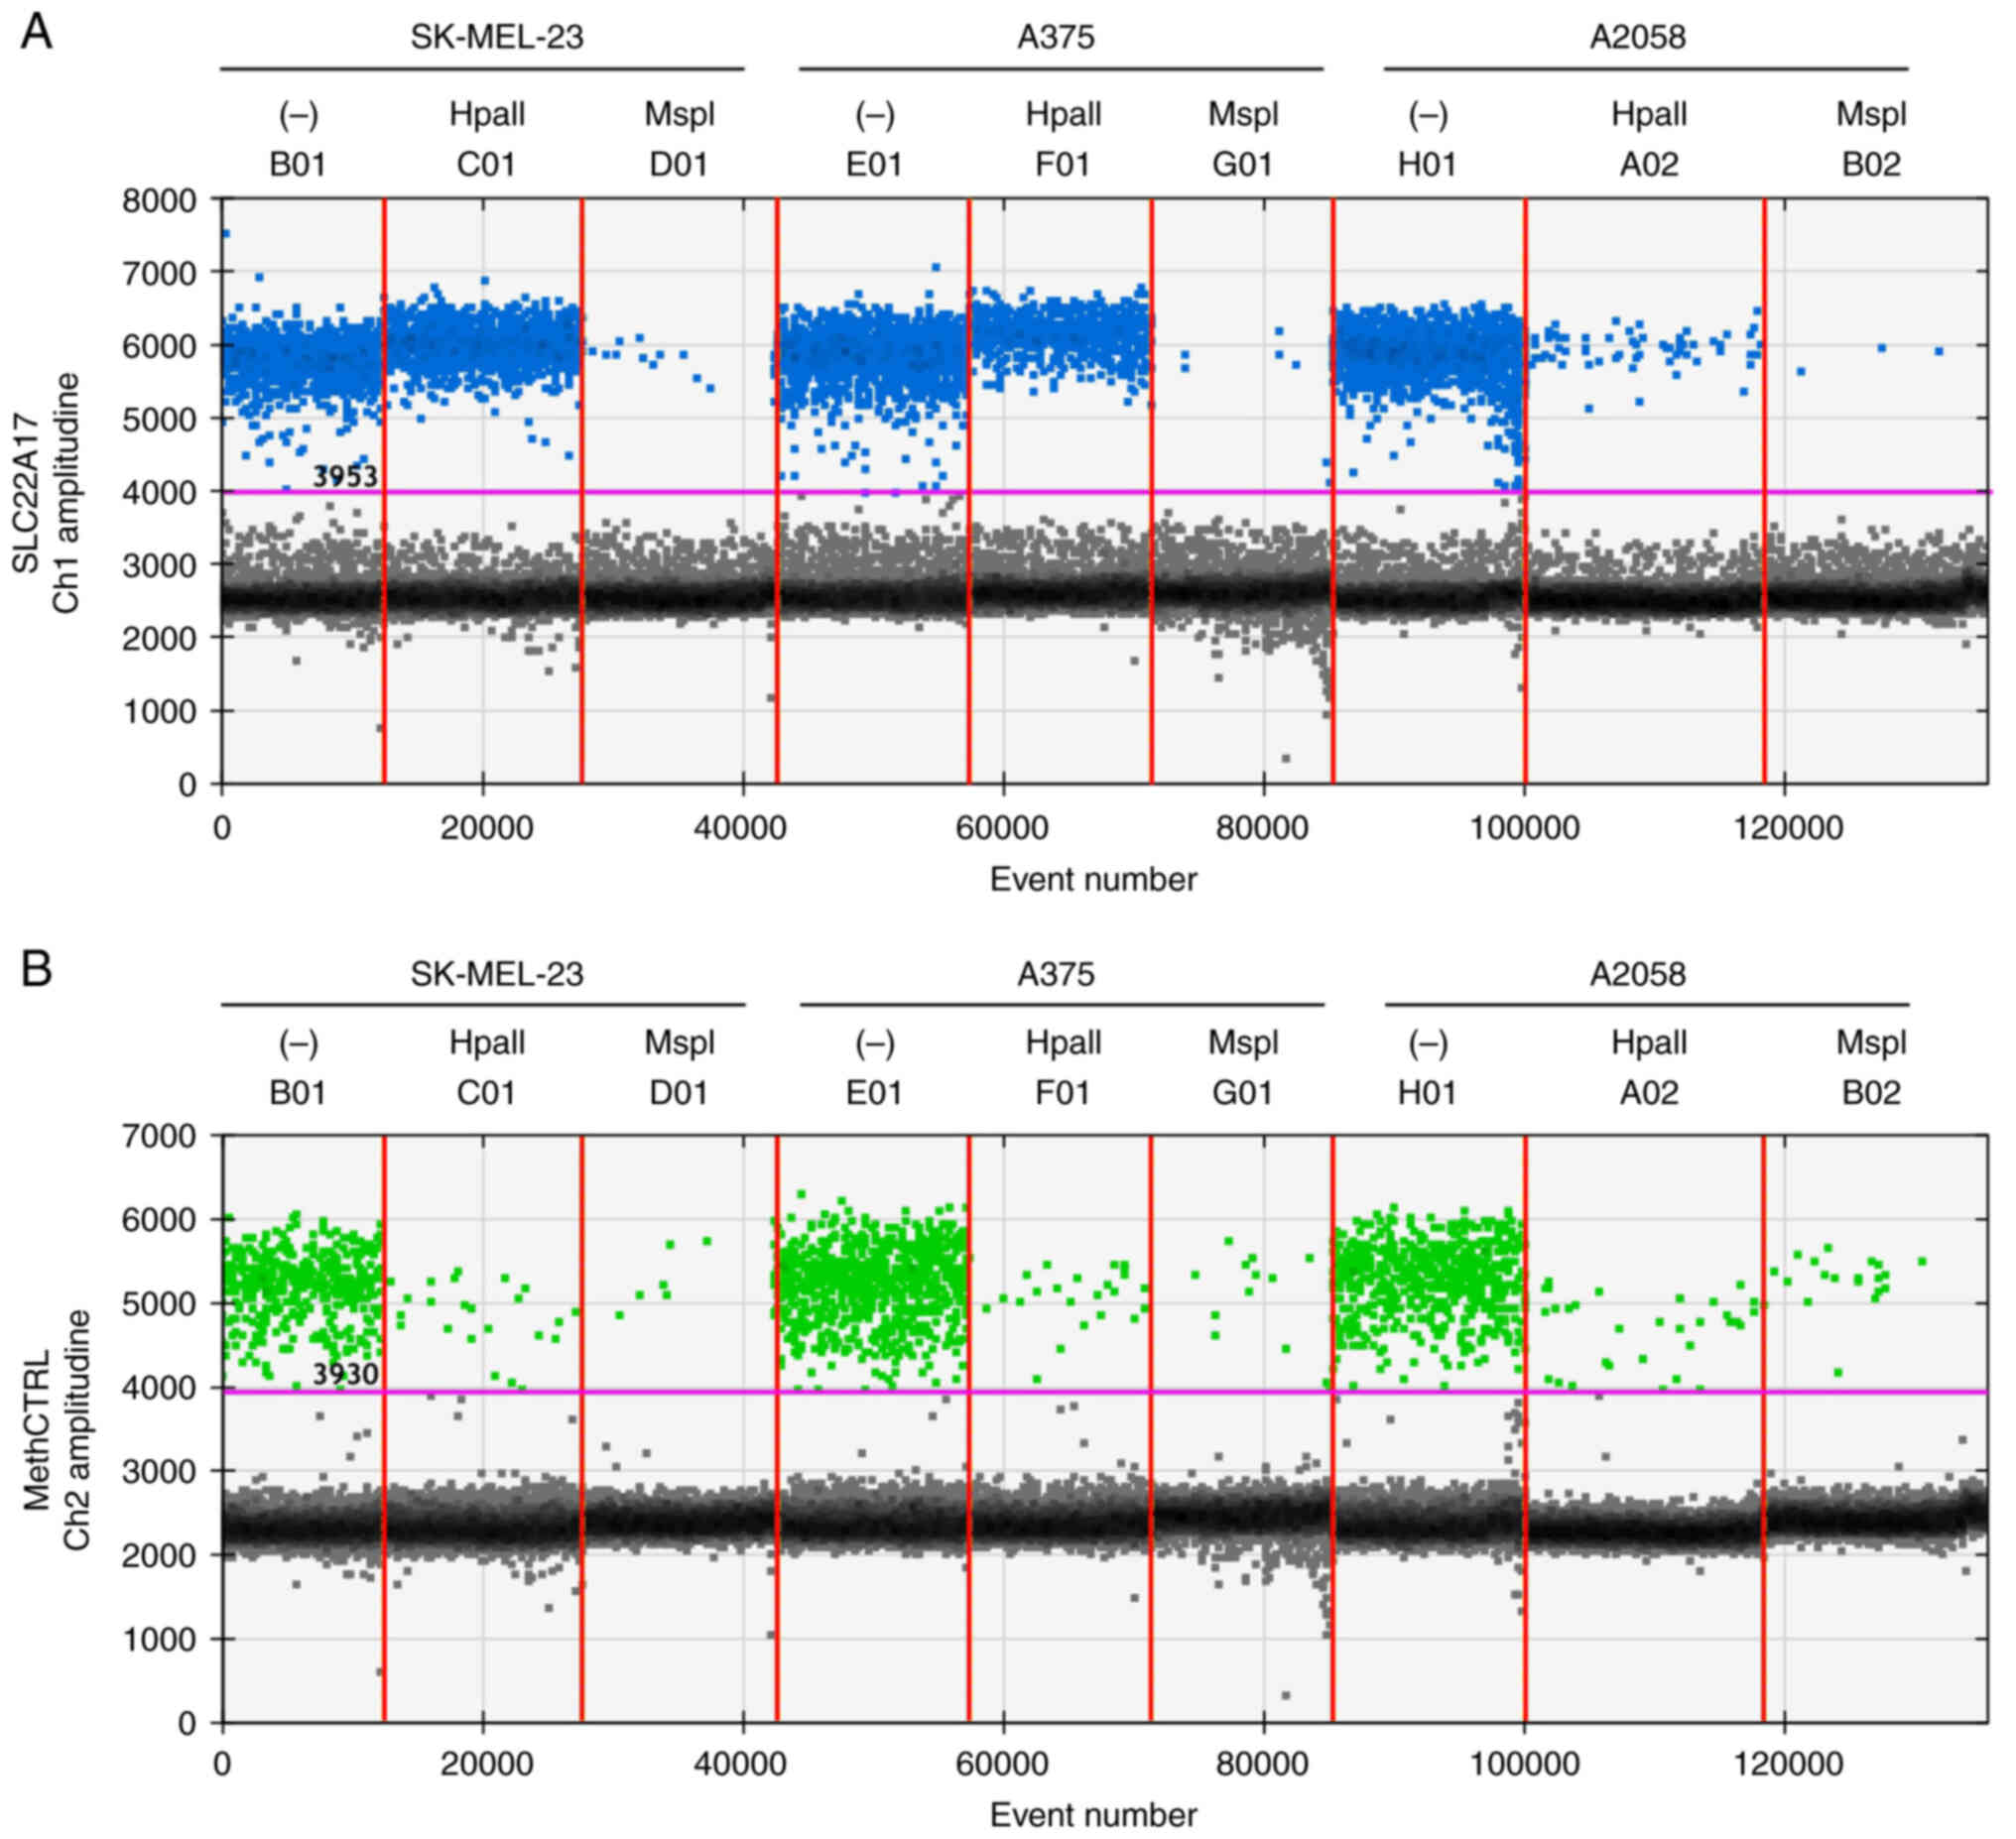
The methylation levels of the SLC22A17 hotspot were higher in SK-MEL-23 (98.18±0.15%) compared with A375 (39.7±0.60%) and A2058 cells (1.16±0.19%) (Fig. 2A and B). Notably, the amplitude of FAM and HEX droplets was comparable to that observed in the setup experiment reported in Fig. 1.
The MSRE-ddPCR results agreed with those obtained from bisulfite sequencing of SLC22A17 hotspot in the same cell lines. In particular, the internal cytosine of CCGG within the SLC22A17 hotspot was unconverted in SK-MEL-23 (Fig. S2A), partially converted (~34% of methDNA) in A375 (Fig. S2B) and converted in A2058 (Fig. S2C), indicating that this hotspot was highly hypermethylated in SK-MEL-23, partially methylated in A375 and unmethylated in the A2058 cells. The absence of amplification signal in the MspI mix for the SLC22A17 target (Fig. 2A), as well as the slight signal detected for methCTRL in HpaII and MspI mix (Fig. 2B), indicated that the restriction enzymes were highly efficient in MSRE-ddPCR mix.
Comparison between MSRE-ddPCR and standard MSRE assays
To assess the reliability of MSRE-ddPCR results, the methylation levels of the SLC22A17 hotspot were also evaluated by the standard MSRE procedure using HpaII and MspI enzymes as aforementioned. The methylation percentage computed through both methods was normalized by the methCTRL signal in HpaII mix and the amplification signal of each target in MspI mix (Table II).
The results indicated that the methylation levels of SLC22A17 target obtained with both MSRE-ddPCR and standard MSRE procedures were comparable showing only a slight reduction of the methDNA percentage estimation (<0,5%) when methCTRL normalization was applied (Table II). Interestingly, the standard MSRE assay was unable to quantify the SLC22A17 methylation hotspot in SK-MEL-23 cells since the SLC22A17 signal was relevant in the MspI mix (~90 copies/μl), suggesting that the MspI enzymatic digestion was inhibited by DNA sample contaminants (Fig. S3). It was probably due to the presence of melanin in the gDNA sample obtained from the highly melanin-pigmented SK-MEL-23 cells that appeared brown-pigmented during the DNA extraction procedure (data not shown). To test this hypothesis, the standard MSRE assay was performed on 20 ng of SK-MEL-23 gDNA (instead of 200 ng of gDNA) in 10 μl of final reaction volume, of which 5 μl were directly added to the ddPCR mix for the amplification. The results revealed an efficient digestion of MspI in SK-MEL-23 diluted gDNA, indicating that the high melanin content of SK-MEL-23 may reduce the efficiency of MspI (Fig. S3A and B). However, the detected amplitude for each diluted sample was significantly reduced compared with standard MSRE procedure due to the amount of the MSRE digestion mix (5 μl of diluted gDNA) used for the downstream analysis, demonstrating that MSRE mix affected the ddPCR amplification (Fig. S3A and B). Notably, the amount of SK-MEL-23 gDNA sample loaded in each standard MSRE mix (200 ng of gDNA in 10 μl final reaction volume) was ~7.5% of the reaction and ~0.75% for diluted gDNA sample (20 ng in 10 μl final reaction volume), whereas it was ~0.34% in each MSRE-ddPCR mix (20 ng of gDNA in 22 μl final reaction volume), considering an initial DNA concentration of 266.7 ng/μl. Therefore, using a lower quantity of DNA in each MSRE-ddPCR mix compared with the standard MSRE mix, the enzymatic inhibition was efficiently prevented.
Interference of restriction enzyme digestion mix on ddPCR amplification
To further evaluate the interference of the standard MSRE digestion mix on the downstream ddPCR amplification and to assess the highest amount of the MSRE digestion mix that may be processed by ddPCR, A375 gDNA was digested with BamHI using its standard reagents. This restriction enzyme was selected since it does not digest the SLC22A17 methDNA hotspot allowing to simulate the inhibition of ddPCR amplification by digestion components independently from the negative effect of MSRE digestion on the number of positive droplets. Specifically, 5 μl of BamHI reaction (1X CutSmart Buffer, 5 UI of BamHI) containing 20 ng of A375 gDNA and 10−6 ng of methCTRL were amplified in ddPCR to detect SLC22A17 target and methCTRL. The same amplification conditions were applied to the control sample consisting of 20 ng of A375 gDNA and 10−6 ng of methCTRL in 5 μl of molecular biology-grade water.
The results revealed that the SLC22A17 amplitude (FAM channel) was reduced by ~1,000 AU fluorescence in the BamHI mix compared with the control mix (Fig. S4A and C). Similarly, a significant reduction of methCTRL amplitude signal was observed in the BamHI reaction compared with the control (~5561 AU fluorescence for the control mix and ~4477 AU fluorescence for the BamHI mix) (Fig. S4B and D). The data confirmed the results obtained for SK-MEL-23 diluted MSRE mix (Fig. S3) indicating that the restriction enzyme reaction, including the MSRE reaction, consistently affected the ddPCR amplification. Therefore, the standard MSRE digestion of low-concentrated DNA samples cannot be analyzed by ddPCR because up to 5 μl of this reaction should be added in each ddPCR mix to reach the sensitivity threshold.
Linearity and sensitivity of MSRE-ddPCR assay
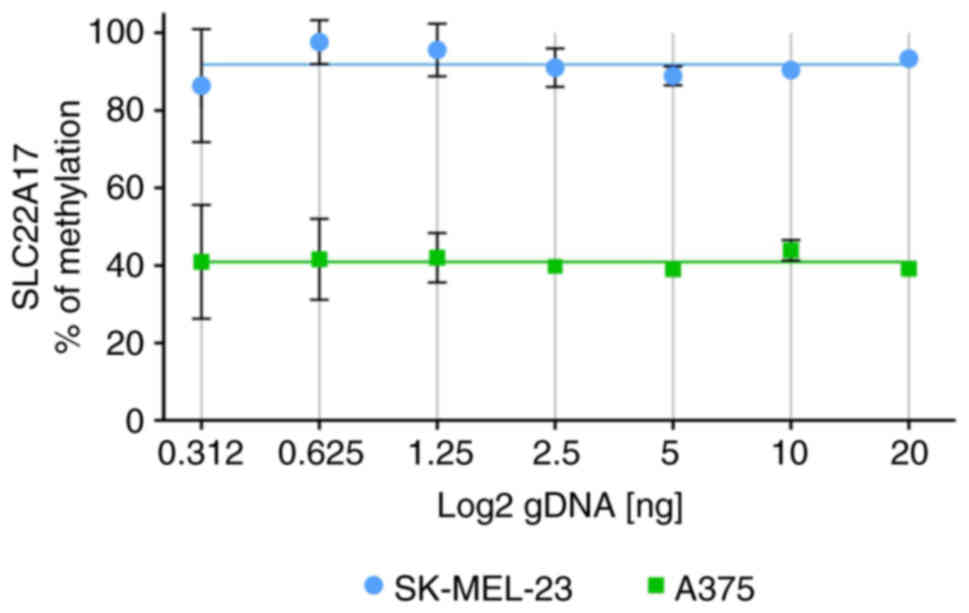
Linearity test of MSRE-ddPCR assay was performed evaluating the SLC22A17 methDNA target using a 2-fold serial dilution starting from 20 to 0.312 ng of gDNA obtained from SK-MEL-23 and A375 cells. The results suggested that the methylation percentage of the SLC22A17 hotspot, whose average values ranged from 88.29 to 95.49% for SK-MEL-23 and 37.65 to 44.20% for A375, demonstrated a slight deviation (3.6% for SK-MEL-23 and 3.27% for A375) from best-fit value (91.89% for SK-MEL-23 and 40.92% for A375) in both the gDNA dilutions. However, a significant increase in standard deviation (SD) was observed starting from 1.25 ng of gDNA, with the highest SD observed for samples diluted at 0.312 ng, suggesting that the accuracy of the MSRE-ddPCR was suitable until the concentration of 0.625 ng (Fig. 3).
Performance analysis of MSRE-ddPCR in low-quality DNA samples
MSRE-ddPCR assay was designed for the methylation analysis of low quantity and/or quality DNA samples, including gDNA from FFPE samples and cfDNA from different body fluids. To test the analytic performance of the MSRE-ddPCR, the SLC22A17 methDNA hotspot (Fig. S1B) was analyzed on a pilot cohort of FFPE melanoma tissues (n=10) and FFPE nevi (n=10). Moreover, to evaluate the adaptability of the MSRE-ddPCR for the analysis of cfDNA, two serum samples from melanoma patients were analyzed as a pilot test.
The plots indicated that the amplitude signal of both FAM and HEX channels was similar to the signal detected for melanoma cell lines (Fig. 4A and B). However, the droplet rain between positive and negative droplets was observed for SLC22A17 methDNA hotspot in the FFPE samples, indicating the presence of PCR inhibitors and DNA fragmentation (Fig. 4A and B). Moreover, these inhibitors slightly reduced the amplitude of the SLC22A17 methDNA hotspot and methCTRL in FFPE and cfDNA samples than melanoma cell lines. However, the amplitude difference did not influence the accuracy of target detection by ddPCR as demonstrated in Fig. S4.
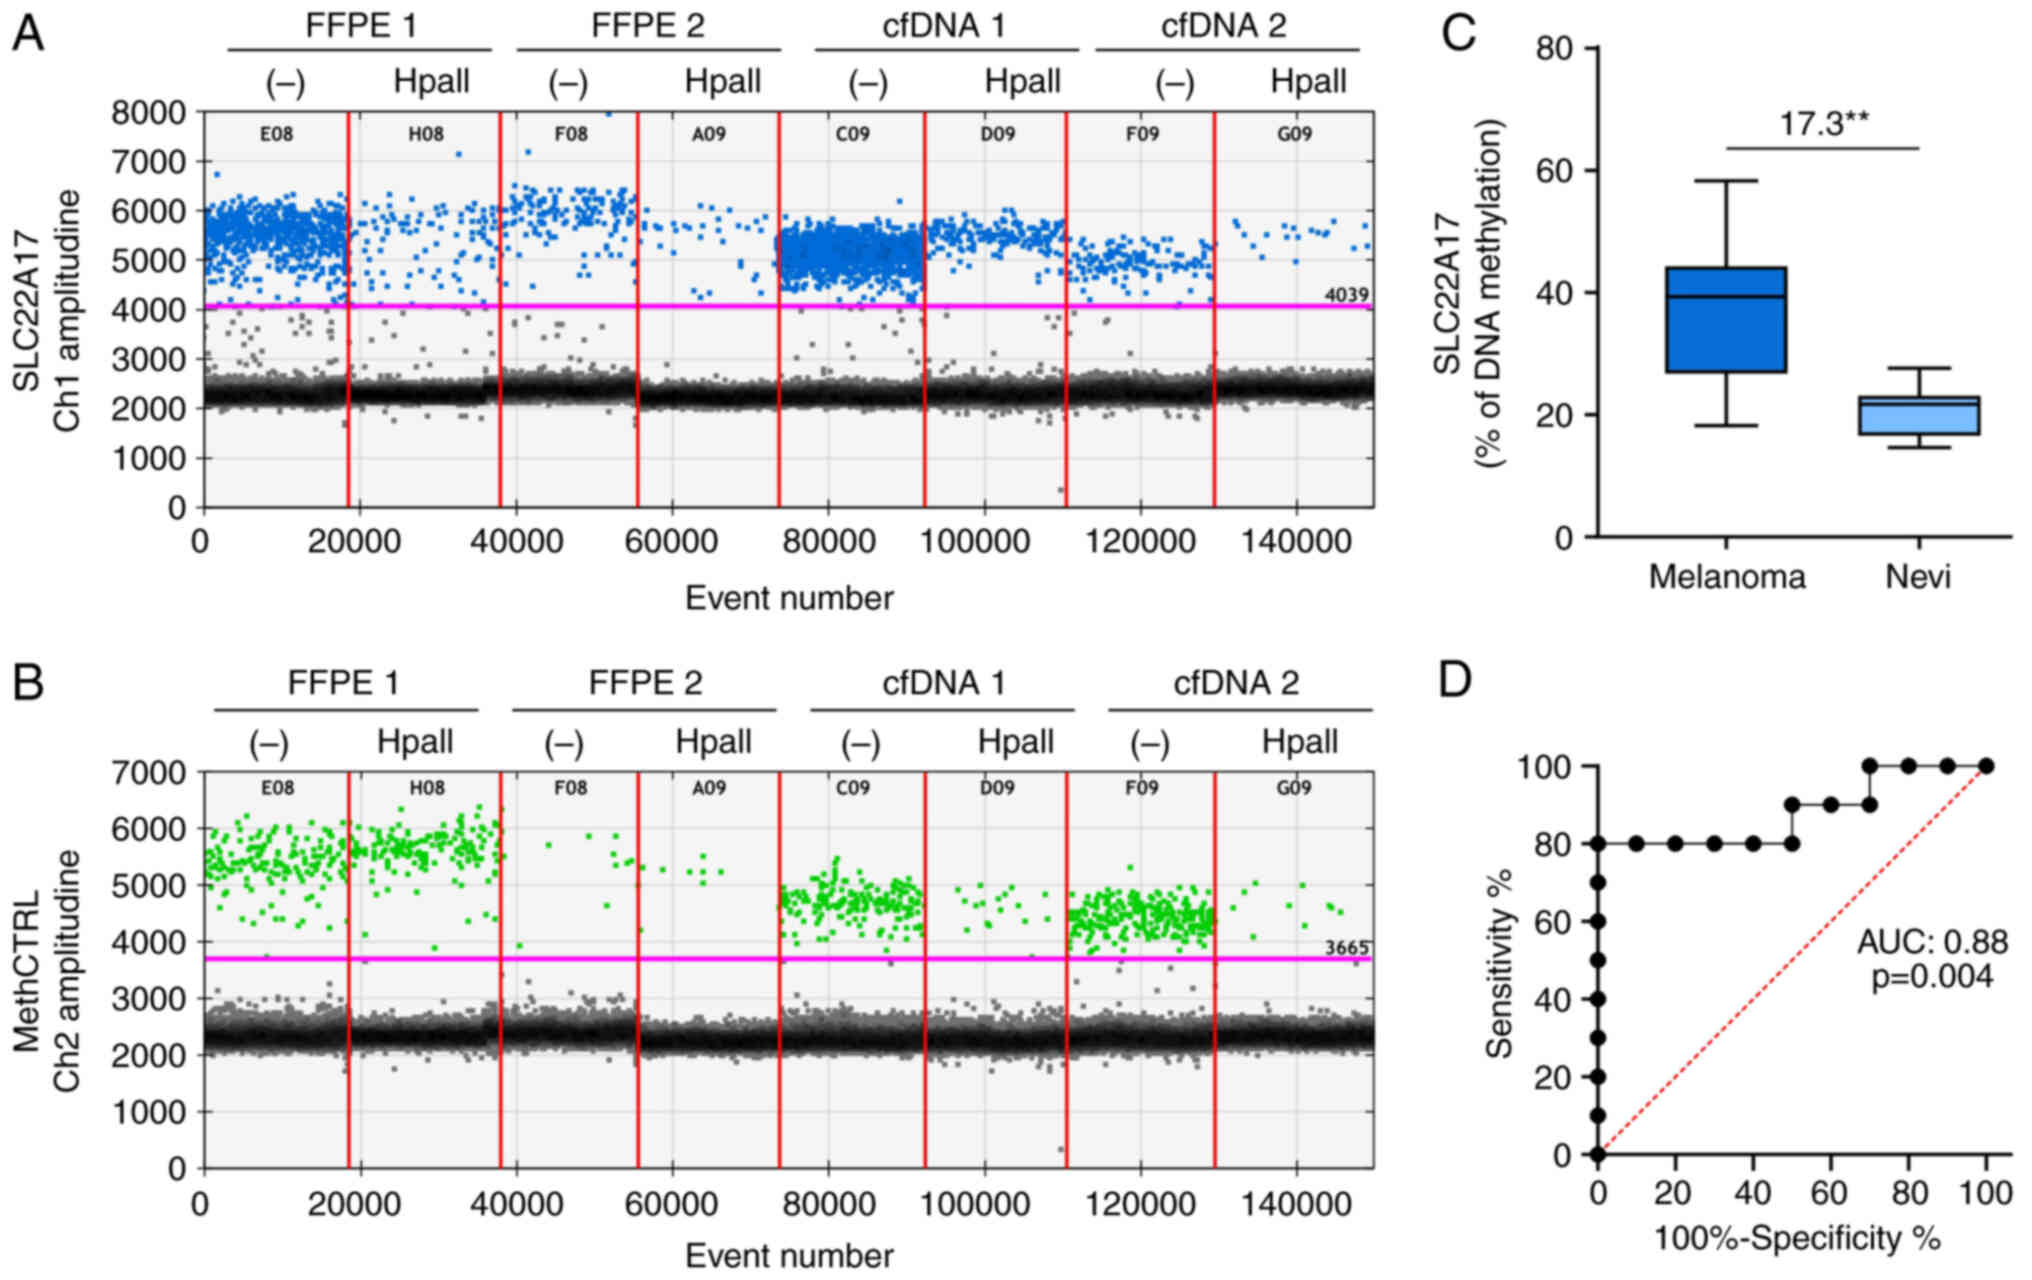
The MSRE-ddPCR analysis revealed that the methylation levels of SLC22A17 were 21.04±0.90% for FFPE 1 and 33.43±1.88% for FFPE 2. Regarding the methylation analysis of serum cfDNA, the SLC22A17 hotspot was 9.74±0.38% for cfDNA 1 and 12.69±0.53% for cfDNA 2 (Fig. 4A and B). The results of SLC22A17 methDNA hotspot analysis on the melanoma and nevi cohorts revealed that the median percentage of methDNA was significantly (P≤0.01) higher in melanoma (39.37%) compared with healthy samples (21.78%) (Fig. 4C). Of note, despite the small number of analyzed samples, the ROC curve analysis demonstrated high sensitivity and specificity [Area Under Curve (AUC): 0.88; P≤0.01] of the SLC22A17 methDNA test as a diagnostic biomarker for melanoma (Fig. 4D).
Discussion
In the last decades the development of high-throughput technologies, including Next Generation Sequencing (NGS) and microarray, has drastically enhanced the knowledge of methDNA status in cancer patients. These technologies allow the generation of large-scale data useful to define the whole methylome and are often publicly available for in silico studies to identify new methDNA targets involved in tumor development and progression (31-33). In this context, the locus-specific evaluation of methDNA is mandatory to validate the in silico results, as well as to analyze low DNA templates typically obtained from FFPE tissues, liquid biopsies and nanovesicles (16,34). Actually, the gold standard pre-processing method to analyze both the whole genome and the single methDNA hotspots, especially for sequencing approaches (i.e. NGS, pyrosequencing, Sanger sequencing) or microarray analyses (i.e. Infinium HumanMethylation450 Bead Chip array by Illumina), is based on the bisulfite conversion (35,36). However, during the bisulfite conversion, the DNA samples are exposed to acidic conditions and high temperatures leading to a consistent DNA fragmentation that may reduce the DNA recovery during the cleanup, as well as the DNA sequencing of long fragments (12,13,16,37,38). Furthermore, the conversion of unmethylated cytosine in uracil (and then thymine during PCR) considerably reduces the complexity of the genome resulting in low specificity of the PCR amplification, as well as the loss of accuracy in the NGS alignment. In addition, the complete conversion of unmethylated cytosines could not be reached for all DNA samples affecting the precise estimation of the methDNA levels (16). Despite the MSRE procedure does not affect the quality or the quantity of DNA for downstream analyses, this method can be only applied to evaluate the CpG hotspots located in the restriction sites recognized by the methyl-sensitive enzymes used in MSRE. Moreover, the MSRE reaction may be inhibited by different DNA contaminants, especially when a large quantity of low-concentrated samples is used for the analysis (19,20). Similarly, a large amount of the MSRE digested sample must be used to reach the PCR sensitivity threshold inducing a significant reduction of the DNA amplification efficiency (19,20).
In the last few years, the ddPCR technology has emerged as a suitable tool for the analysis of low-quantity and/or -quality DNA samples (25,39). Moreover, this technology has recently been adopted for the analysis of methDNA by MSRE to overcome the limitations of standard procedures. In particular, several studies have demonstrated that the ddPCR amplification of MSRE-digested samples enhanced the sensitivity of methDNA target detection compared with previous generations of PCR (endpoint, qPCR) (21,22,24,40). Interestingly, since the ddPCR reaction mix is compatible with restriction enzyme activity, van Zogchel et al (23) evaluated the methylation status of Ras association domain family member 1 (RASSF1A) in liquid biopsy samples performing MSRE reaction directly within the ddPCR mix. In this field, the MSRE-ddPCR assay was proposed by the authors, a custom one-tube protocol based on the combination of the MSRE reaction and the high-sensitive ddPCR amplification and the use of spike-in methylation control, named methCTRL. In particular, the MSRE-ddPCR approach is based on the use of the methyl-sensitive restriction enzymes (i.e. HpaII and MspI), which are directly loaded in the ddPCR mix to perform digestion of the DNA targets before droplet generation and amplification steps. This allows us to reduce the systematic errors related to the high number of analytic steps and pipetting, which occur in the standard MSRE procedure. Furthermore, up to 5 μl of DNA diluted sample can be loaded in each MSRE-ddPCR mix to reach the ddPCR sensitive threshold. Notably, the ddPCR amplification performed on diluted DNA samples, pre-processed with standard MSRE digestion, needs a large amount of the digested sample that could drastically inhibits the amplification due to the presence of PCR inhibitors (digestion buffer and enzymes) contained within the MSRE mix (Figs. S3 and S4).
The main significant advantage of the MSRE-ddPCR is represented by the design of the methCTRL that consists of an exogenous unmethylated DNA sequence containing one CCGG site specific for HpaII and MspI. In particular, the methCTRL is added to the sample to assess the efficiency of the enzymatic digestion in each MSRE-ddPCR mix. Since the cleavage of the methCTRL may be affected by inhibitors within the sample, no amplification signal should be detected in each MSRE-ddPCR digestion mix containing no inhibitors.
Of note, the methCTRL is useful to directly assess the HpaII efficiency in each MSRE-ddPCR mix independently from the MspI reaction. Since the assessment of the methDNA levels depends on the HpaII activity on CCGG sites, the use of methCTRL ensures the accurate estimation of the methylation status of each methDNA hotspot and allows the evaluation of specific HpaII inhibitors or other issues, including inappropriate enzyme storage. Therefore, the use of the MspI control mix is not required to normalize the methDNA quantification.
To test the validity of the MSRE-ddPCR assay, setup and validation experiments were performed analyzing a methDNA hotspot within SLC22A17, a gene known to be widely involved in the development, progression, and drug resistance of several tumor types, including melanoma (41-46). Specifically, the gDNA extracted from melanoma cell lines, melanoma and nevi FFPE tissues, and cfDNA obtained from two melanoma patients was analyzed for SLC22A17 methDNA hotspot. The results indicated that the MSRE-ddPCR assessment of this methDNA hotspot was comparable to the standard MSRE assay demonstrating that restriction enzyme activity was not affected by ddPCR chemistry. This result was confirmed by bisulfite sequencing of the SLC22A17 methDNA hotspot, which shows a hypermethylation of the SLC22A17 hotspot in SK-MEL-23, a partial methylation in A375 cells, and hypomethylation in A2058 cells. Furthermore, the MSRE-ddPCR assay was suitable to analyze critical DNA samples, including the low-concentrated DNA and gDNA from high melanin-pigmented SK-MEL-23 cells. Notably, the standard MSRE failed the evaluation of the SLC22A17 methDNA hotspot since the PCR amplification signal was strongly detected in the MspI mix. Although the issue was overcome by diluting the gDNA sample, the ddPCR amplification was significantly affected by the large amount of the MSRE mix required to reach the sensitivity threshold (Fig. S3). Conversely, the same methDNA target was efficiently measured by ddPCR-MSRE as demonstrated by the absence of signal in the MspI mix (Fig. 2A). However, optimization experiments should be performed to test the MSRE-ddPCR accuracy of each specific target considering the pigmentation levels of melanoma specimens. Of note, the presence of melanin, which is not removed during the purification steps, may affect PCR-based assays even in low-concentrated DNA samples (47,48).
Setup experiments demonstrated the sensitivity and linearity of the MSRE-ddPCR for the methylation analysis of low-concentrated DNA samples. In addition, the analytical potential of this assay in the detection of methDNA hotspots was also demonstrated in a cohort of melanoma and normal samples, indicating the strength and reproducibility of the MSRE-ddPCR method in the detection of epigenetic cancer-related biomarkers. Interestingly, although the pilot test on cfDNA suggested the potential extensibility of the MSRE-ddPCR for the analysis of liquid biopsy samples, further investigations should be undertaken to validate its application in routine setting.
The MSRE-ddPCR is a valuable method for methDNA analysis, which not requires any DNA pre-processing steps (i.e. standard MSRE and bisulfite conversion) affecting the DNA quality/quantity for the downstream amplification. However, the number and location of HpaII restriction sites may reduce the coverage of methylation analysis compared with the bisulfite sequencing that allows quantifying the methylation status with the single-CpG resolution. This limitation may be partially overcome using other methylation-sensitive enzymes (i.e. HhaI, BstUI and AciI) for each of which optimization tests could be required to assess the compatibility with ddPCR chemistry, as well as the design of appropriate methCTRLs.
Another limitation of the MSRE-ddPCR assay may be due to the presence of multiple enzymatic restriction sites within the DNA target, which result in a misestimation of the methylation levels. In particular, a single unmethylated restriction site is responsible for the total digestion of the DNA target affecting the evaluation of the methylation status for other CpG restriction sites. Therefore, the design of gene-specific primers flanking a single methylation-sensitive restriction site is mandatory to perform an accurate analysis.
Overall, the ddPCR-MSRE assay represents an efficient one-tube method for reproducible and highly sensitive analyses of specific methDNA hotspots in several DNA samples, including low quantity and/or quality DNA from canonical and non-canonical biological matrices.
Supplementary Data
Availability of data and materials
All data generated or analyzed during this study are included in this published article and its supplementary information files. The sequencing data generated in this study were deposited in the Zenodo platform (https://doi.org/10.5281/zenodo.7840070) (created and accessed on 18 April 2023) and are also available from the corresponding author on reasonable request.
Authors' contributions
GG, AL, LF and SC performed the experiments. GG, AL, SC, RC, GM, MC, LF, PAA and ML interpreted and analyzed data and drafted the manuscript. LF, ML, RC, GM, MC and PAA edited the manuscript and provided critical revisions. SC, ML and LF designed and supervised the study. LF, GM and PAA obtained resources and funding for the study. SC and GG confirm the authenticity of all the raw data. All authors read and approved the final manuscript.
Ethics approval and consent to participate
The present study was conducted in accordance with the guidelines of the Declaration of Helsinki and approved by the Institutional Review Board of the Istituto Nazionale Tumori IRCCS Fondazione 'G. Pascale' (Naples, Italy) (protocol code 33/17oss, approved on 10 January 2018). Informed consent was obtained from all subjects involved in the study.
Patient consent for publication
Not applicable.
Competing interests
PAA has/had consultant/advisory roles for Bristol Myers Squibb, Roche-Genentech, Merck Sharp & Dohme, Novartis, Merck Serono, Pierre-Fabre, AstraZeneca, Sun Pharma, Sanofi, Idera, Sandoz, Immunocore, 4SC, Italfarmaco, Nektar, Boehringer-Ingelheim, Eisai, Regeneron, Daiichi Sankyo, Pfizer, Oncosec, Nouscom, Lunaphore, Seagen, iTeos, Medicenna, and Bio-Al Health. He also received research funding from Bristol Myers Squibb, Roche-Genentech, Pfizer, and Sanofi; all of the above took place outside the submitted work. All other authors declare that they have no competing interests.
Acknowledgments
The authors would like to thank the Italian League against Cancer (LILT) for the support.
Funding
The present study was supported by the Italian Ministry of Health (IT-MOH) through 'Ricerca Corrente' (grant no. L2-1), the Italian League Against Cancer (LILT) and the PON AIM R&I (grant no. 2014-2020-E66C18001250007.
References
|
Bonin S and Stanta G: Pre-analytics and tumor heterogeneity. N Biotechnol. 55:30–35. 2020. View Article : Google Scholar | |
|
Dagogo-Jack I and Shaw AT: Tumour heterogeneity and resistance to cancer therapies. Nat Rev Clin Oncol. 15:81–94. 2018. View Article : Google Scholar | |
|
Falzone L, Bordonaro R and Libra M: SnapShot: Cancer chemotherapy. Cell. 186:1816–1816.e1. 2023. View Article : Google Scholar | |
|
Baylin SB and Jones PA: Epigenetic determinants of cancer. Cold Spring Harb Perspect Biol. 8:a0195052016. View Article : Google Scholar : PubMed/NCBI | |
|
Ilango S, Paital B, Jayachandran P, Padma PR and Nirmaladevi R: Epigenetic alterations in cancer. Front Biosci (Landmark Ed). 25:1058–1109. 2020. View Article : Google Scholar : PubMed/NCBI | |
|
Klutstein M, Nejman D, Greenfield R and Cedar H: DNA methylation in cancer and aging. Cancer Res. 76:3446–3450. 2016. View Article : Google Scholar : PubMed/NCBI | |
|
Moore LD, Le T and Fan G: DNA methylation and its basic function. Neuropsychopharmacology. 38:23–38. 2013. View Article : Google Scholar | |
|
Dhar GA, Saha S, Mitra P and Nag Chaudhuri R: DNA methylation and regulation of gene expression: Guardian of our health. Nucleus (Calcutta). 64:259–270. 2021. View Article : Google Scholar : PubMed/NCBI | |
|
Hao X, Luo H, Krawczyk M, Wei W, Wang W, Wang J, Flagg K, Hou J, Zhang H, Yi S, et al: DNA methylation markers for diagnosis and prognosis of common cancers. Proc Natl Acad Sci USA. 114:7414–7419. 2017. View Article : Google Scholar : PubMed/NCBI | |
|
Pettini F, Visibelli A, Cicaloni V, Iovinelli D and Spiga O: Multi-omics model applied to cancer genetics. Int J Mol Sci. 22:57512021. View Article : Google Scholar : PubMed/NCBI | |
|
Papanicolau-Sengos A and Aldape K: DNA methylation profiling: An emerging paradigm for cancer diagnosis. Annu Rev Pathol. 17:295–321. 2022. View Article : Google Scholar | |
|
Grunau C, Clark SJ and Rosenthal A: Bisulfite genomic sequencing: SYstematic investigation of critical experimental parameters. Nucleic Acids Res. 29:E652001. View Article : Google Scholar : PubMed/NCBI | |
|
Tanaka K and Okamoto A: Degradation of DNA by bisulfite treatment. Bioorg Med Chem Lett. 17:1912–1915. 2007. View Article : Google Scholar : PubMed/NCBI | |
|
Li Q, Hermanson PJ and Springer NM: Detection of DNA methylation by whole-genome bisulfite sequencing. Methods Mol Biol. 1676:185–196. 2018. View Article : Google Scholar | |
|
Mehrmohamadi M, Sepehri MH, Nazer N and Norouzi MR: A comparative overview of epigenomic profiling methods. Front Cell Dev Biol. 9:7146872021. View Article : Google Scholar : PubMed/NCBI | |
|
Kurdyukov S and Bullock M: DNA methylation analysis: Choosing the right method. Biology (Basel). 5:32016.PubMed/NCBI | |
|
Šestáková Š, Šálek C and Remešová H: DNA methylation validation methods: A coherent review with practical comparison. Biol Proced Online. 21:192019. View Article : Google Scholar : PubMed/NCBI | |
|
Beikircher G, Pulverer W, Hofner M, Noehammer C and Weinhaeusel A: Multiplexed and sensitive DNA methylation testing using methylation-sensitive restriction enzymes 'MSRE-qPCR'. Methods Mol Biol. 1708:407–424. 2018. View Article : Google Scholar | |
|
Melnikov AA, Gartenhaus RB, Levenson AS, Motchoulskaia NA and Levenson Chernokhvostov VV: MSRE-PCR for analysis of gene-specific DNA methylation. Nucleic Acids Res. 33:e932005. View Article : Google Scholar : PubMed/NCBI | |
|
Chapman KB and Higgs BW: Selective amplification of hypermethylated DNA from diverse tumor types via MSRE-PCR. Oncotarget. 11:4387–4400. 2020. View Article : Google Scholar : PubMed/NCBI | |
|
Nell RJ, van Steenderen D, Menger NV, Weitering TJ, Versluis M and van der Velden PA: Quantification of DNA methylation independent of sodium bisulfite conversion using methylation-sensitive restriction enzymes and digital PCR. Hum Mutat. 41:2205–2216. 2020. View Article : Google Scholar : PubMed/NCBI | |
|
Wang D, O'Rourke D, Sanchez-Garcia JF, Cai T, Scheuenpflug J and Feng Z: Development of a liquid biopsy based purely quantitative digital droplet PCR assay for detection of MLH1 promoter methylation in colorectal cancer patients. BMC Cancer. 21:7972021. View Article : Google Scholar : PubMed/NCBI | |
|
van Zogchel LMJ, Lak NSM, Verhagen OJHM, Tissoudali A, Gussmalla Nuru M, Gelineau NU, Zappeij-Kannengieter L, Javadi A, Zijtregtop EAM, Merks JHM, et al: Novel circulating hypermethylated RASSF1A ddPCR for liquid biopsies in patients with pediatric solid tumors. JCO Precis Oncol. 5:PO.21.001302021.PubMed/NCBI | |
|
Metzenmacher M, Hegedüs B, Forster J, Schramm A, Horn PA, Klein CA, Bielefeld N, Ploenes T, Aigner C, Theegarten D, et al: Combined multimodal ctDNA analysis and radiological imaging for tumor surveillance in Non-small cell lung cancer. Transl Oncol. 15:1012792022. View Article : Google Scholar | |
|
Olmedillas-López S, Olivera-Salazar R, García-Arranz M and García-Olmo D: Current and emerging applications of droplet digital PCR in oncology: An updated review. Mol Diagn Ther. 26:61–87. 2022. View Article : Google Scholar | |
|
Gattuso G, Falzone L, Costa C, Giambò F, Teodoro M, Vivarelli S, Libra M and Fenga C: Chronic pesticide exposure in farm workers is associated with the epigenetic modulation of hsa-miR-199a-5p. Int J Environ Res Public Health. 19:70182022. View Article : Google Scholar : PubMed/NCBI | |
|
Crimi S, Falzone L, Gattuso G, Grillo CM, Candido S, Bianchi A and Libra M: Droplet digital PCR analysis of liquid biopsy samples unveils the diagnostic Role of hsa-miR-133a-3p and hsa-miR-375-3p in oral cancer. Biology (Basel). 9:3792020.PubMed/NCBI | |
|
Pharo HD, Andresen K, Berg KCG, Lothe RA, Jeanmougin M and Lind GE: A robust internal control for high-precision DNA methylation analyses by droplet digital PCR. Clin Epigenetics. 10:242018. View Article : Google Scholar : PubMed/NCBI | |
|
Lin WH, Xiao J, Ye ZY, Wei DL, Zhai XH, Xu RH, Zeng ZL and Luo HY: Circulating tumor DNA methylation marker MYO1-G for diagnosis and monitoring of colorectal cancer. Clin Epigenetics. 13:2322021. View Article : Google Scholar : PubMed/NCBI | |
|
Salemi R, Falzone L, Madonna G, Polesel J, Cinà D, Mallardo D, Ascierto PA, Libra M and Candido S: MMP-9 as a candidate marker of response to BRAF inhibitors in melanoma patients with BRAFV600E mutation detected in circulating-free DNA. Front Pharmacol. 9:8562018. View Article : Google Scholar | |
|
Barros-Silva D, Marques CJ, Henrique R and Jerónimo C: Profiling DNA methylation based on next-generation sequencing approaches: New insights and clinical applications. Genes (Basel). 9:4292018. View Article : Google Scholar : PubMed/NCBI | |
|
Nikolouzakis TK, Falzone L, Lasithiotakis K, Krüger-Krasagakis S, Kalogeraki A, Sifaki M, Spandidos DA, Chrysos E, Tsatsakis A and Tsiaoussis J: Current and future trends in molecular biomarkers for diagnostic, prognostic, and predictive purposes in non-melanoma skin cancer. J Clin Med. 9:28682020. View Article : Google Scholar : PubMed/NCBI | |
|
Merkel A and Esteller M: Experimental and bioinformatic approaches to studying DNA methylation in cancer. Cancers (Basel). 14:3492022. View Article : Google Scholar : PubMed/NCBI | |
|
Gai W and Sun K: Epigenetic biomarkers in cell-free DNA and applications in liquid biopsy. Genes (Basel). 10:322019. View Article : Google Scholar : PubMed/NCBI | |
|
Smith J, Day RC and Weeks RJ: Next-generation bisulfite sequencing for targeted DNA methylation analysis. Methods Mol Biol. 2458:47–62. 2022. View Article : Google Scholar : PubMed/NCBI | |
|
Leti F, Llaci L, Malenica I and Di Stefano JK: Methods for CpG methylation array profiling via bisulfite conversion. Methods Mol Biol. 1706:233–254. 2018. View Article : Google Scholar : PubMed/NCBI | |
|
Kint S, De Spiegelaere W, De Kesel J, Vandekerckhove L and Van Criekinge W: Evaluation of bisulfite kits for DNA methylation profiling in terms of DNA fragmentation and DNA recovery using digital PCR. PLoS One. 13:e01990912018. View Article : Google Scholar : PubMed/NCBI | |
|
Hong SR and Shin KJ: Bisulfite-converted DNA quantity evaluation: A multiplex quantitative real-time PCR system for evaluation of bisulfite conversion. Front Genet. 12:6189552021. View Article : Google Scholar : PubMed/NCBI | |
|
Lavoro A, Scalisi A, Candido S, Zanghì GN, Rizzo R, Gattuso G, Caruso G, Libra M and Falzone L: Identification of the most common BRCA alterations through analysis of germline mutation databases: Is droplet digital PCR an additional strategy for the assessment of such alterations in breast and ovarian cancer families? Int J Oncol. 60:582022. View Article : Google Scholar : PubMed/NCBI | |
|
Van Wesenbeeck L, Janssens L, Meeuws H, Lagatie O and Stuyver L: Droplet digital PCR is an accurate method to assess methylation status on FFPE samples. Epigenetics. 13:207–213. 2018. View Article : Google Scholar : PubMed/NCBI | |
|
Candido S, Tomasello B, Lavoro A, Falzone L, Gattuso G, Russo A, Paratore S, McCubrey JA and Libra M: Bioinformatic analysis of the LCN2-SLC22A17-MMP9 network in cancer: The role of DNA methylation in the modulation of tumor microenvironment. Front Cell Dev Biol. 10:9455862022. View Article : Google Scholar : PubMed/NCBI | |
|
Chi Y, Remsik J, Kiseliovas V, Derderian C, Sener U, Alghader M, Saadeh F, Nikishina K, Bale T, Iacobuzio-Donahue C, et al: Cancer cells deploy lipocalin-2 to collect limiting iron in leptomeningeal metastasis. Science. 369:276–282. 2020. View Article : Google Scholar : PubMed/NCBI | |
|
Liu F, Li N, Yang W, Wang R, Yu J and Wang X: The expression analysis of NGAL and NGALR in clear cell renal cell carcinoma. Gene. 676:269–278. 2018. View Article : Google Scholar : PubMed/NCBI | |
|
Gomez-Chou SB, Swidnicka-Siergiejko AK, Badi N, Chavez-Tomar M, Lesinski GB, Bekaii-Saab T, Farren MR, Mace TA, Schmidt C, Liu Y, et al: Lipocalin-2 promotes pancreatic ductal adenocarcinoma by regulating inflammation in the tumor microenvironment. Cancer Res. 77:2647–2660. 2017. View Article : Google Scholar : PubMed/NCBI | |
|
Miyamoto T, Kashima H, Yamada Y, Kobara H, Asaka R, Ando H, Higuchi S, Ida K, Mvunta DH and Shiozawa T: Lipocalin 2 enhances migration and resistance against cisplatin in endometrial carcinoma cells. PLoS One. 11:e01552202016. View Article : Google Scholar : PubMed/NCBI | |
|
Wei J, Gao X, Qin Y, Liu T and Kang Y: An iron metabolism-related SLC22A17 for the prognostic value of gastric cancer. Onco Targets Ther. 13:12763–12775. 2020. View Article : Google Scholar : PubMed/NCBI | |
|
Frouin E, Maudelonde T, Senal R, Larrieux M, Costes V, Godreuil S, Vendrell JA and Solassol J: Comparative methods to improve the detection of BRAF V600 mutations in highly pigmented melanoma specimens. PLoS One. 11:e01586982016. View Article : Google Scholar : PubMed/NCBI | |
|
Vicente ALSA, Bianchini RA, Laus AC, Macedo G, Reis RM and Vazquez VL: Comparison of protocols for removal of melanin from genomic DNA to optimize PCR amplification of DNA purified from highly pigmented lesions. Histol Histopathol. 34:1089–1096. 2019.PubMed/NCBI |